
In my career, I’ve been lucky enough to work established defense industry programs as well as starting up new products and factories. This has given me many opportunities to see problems and do something to fix them. I’ve used many Lean tools over the course of my career and I would like to explore these tools with real world examples of how they were applied and the results they produced.
The first of this (hopeful) series will look at the spaghetti diagram. In its simplest terms, a spaghetti diagram is a visual representation of how people or processes move in a factory or work cell. Specifically, it is how the process happens in reality, not how the process is supposed to work or how an ideal process happens. So this means going out to the floor and watching and recording what happens on a paper layout of the work space.
I recently was responsible for the layout of a production process for a $7.0 million (each!) space vehicle in a brand new facility. I had worked the same product in the original production facility, which allowed me to benchmark the current process. Since I was responsible for all aspects of production in the new facility (tooling, training, metrics, layout, facilitization, etc.) I could take the benchmark data from the original facility and make the improvements I thought necessary in the new factory. This also meant I had an apples to apples comparison of the improvement from the old process to the newly optimized method.
The original factory was set up in an explosives production area due to the rocket motors involved (class 1.3 explosives). Typically, a facility that handles explosives is set up in ‘bays’. These bays are built with concrete walls separating them and a frangible, blow out wall to release the overpressure of an inadvertent explosion or rocket motor ignition. This set up also meant inefficiencies, as is evident by the spaghetti diagram of the original process.
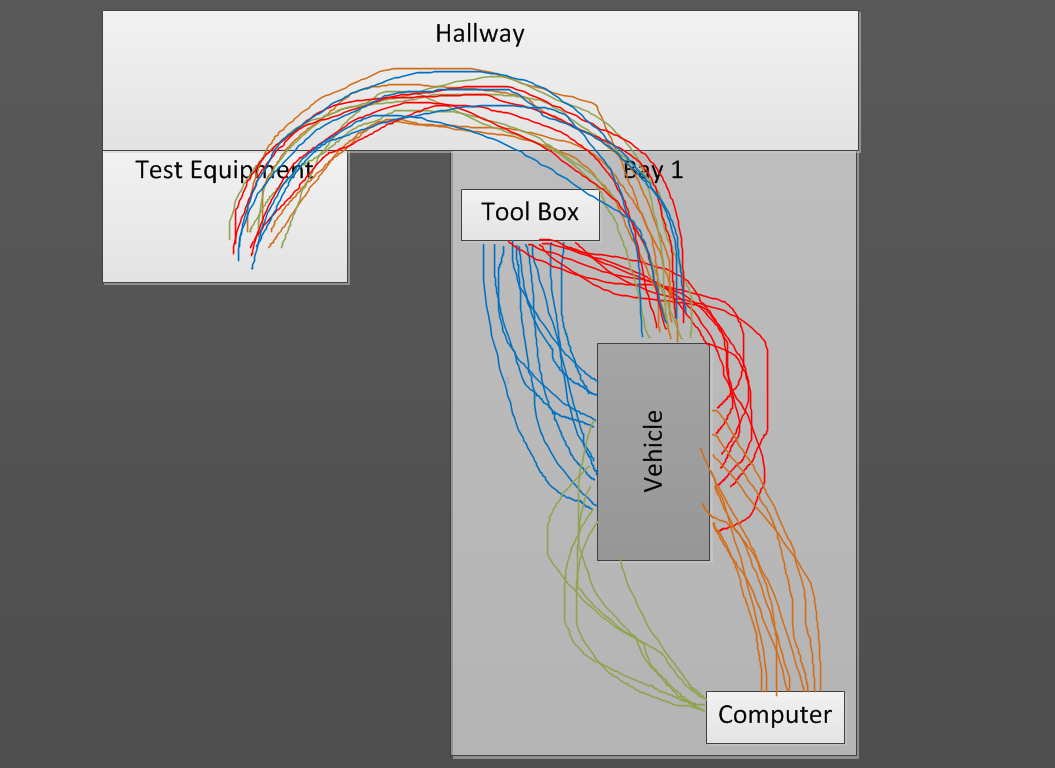
Figure 1. Original process and layout.
With the original process, there was a lot of wasted motion. The bays were too big for the product being assembled and the nature of the bay meant it was isolated from the other production areas. Operators moved many feet from the product to the tool rack and back. The test equipment was set up in a separate bay, meaning the operators had to move the vehicle to the test equipment and back - twice. The instructions used to do the work were located on a computer against a wall. The operators were constantly in motion, and due to the layout and the available material handling tools, more operators were required to do the work. The spaghetti diagram highlighted just how much motion was wasted moving from the vehicle to the computer or the tool rack.
In the new facility, I changed basically every part of the process, following a lean methodology. The factory work cell layout was changed from the bay style to a true ‘U’ cell layout. All new tooling was developed to increase efficiency. The build orientation of the vehicle was changed to remove time consuming and dangerous material lifts. The test equipment was brought to the cell, instead of taking the vehicle to the test equipment. Tool boxes and computers were located such that the operator only had to take one step left or right to get a tool or enter data in the computer.
In the new facility, I changed basically every part of the process, following a lean methodology. The factory work cell layout was changed from the bay style to a true ‘U’ cell layout. All new tooling was developed to increase efficiency. The build orientation of the vehicle was changed to remove time consuming and dangerous material lifts. The test equipment was brought to the cell, instead of taking the vehicle to the test equipment. Tool boxes and computers were located such that the operator only had to take one step left or right to get a tool or enter data in the computer.
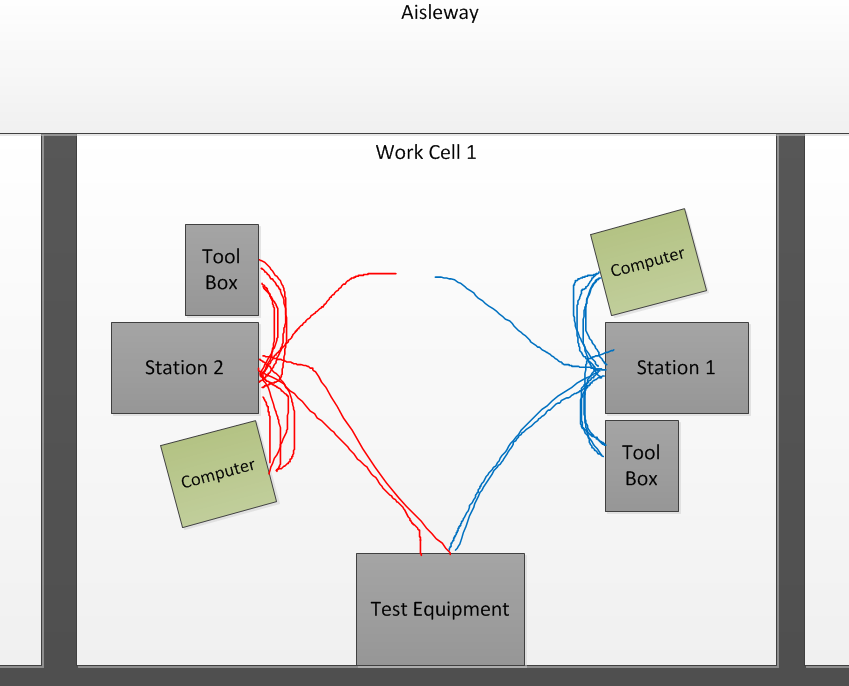
Figure 2. Redesigned process and layout.
In the end, efficiency, safety and cycle time were all greatly improved. What took 5 operators 4.5 days to build in the old factory, was now being accomplished in 2.5 days with only 2 operators. It used to take 180 man hours to build the vehicle; the new process dropped that to 40 man hours! That equates to a 77% reduction in touch labor charges per vehicle. Using a spaghetti diagram of the original set up allowed us to visualize the process and highlight the areas in need of improvement. After making changes, revisiting the spaghetti diagram for the new process provided a measurement of ‘goodness’ for the new process. Keeping in the spirit of Kaizen, the spaghetti diagram of the new process will also help inform changes for the future to help make the process even more lean and efficient.
 RSS Feed